Pivot Tables
PivotTables display aggregated views of data easily and in an understandable layout. Hundreds or thousands of pieces of underlying information can be aggregated on row & column axes, revealing the meanings behind the data. PivotTable reports are used to organize and summarize your data in different ways. Creating a PivotTable report is about moving pieces of information around to see how they fit together. In a few gestures the pivot rows and columns can be moved into different arrangements and layouts.
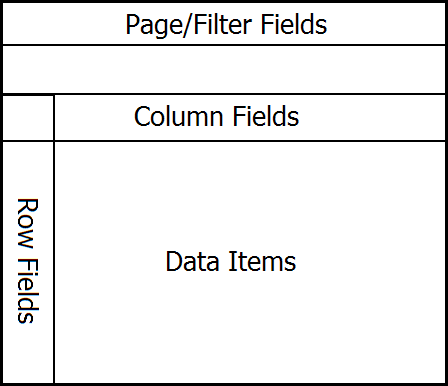
A PivotTable object has a row axis area, a column axis area, a data area, and a page/report filter area. Additionally, PivotTables have a corresponding field list pane, or similar user interface, that displays all the fields of data that can be placed on one of the PivotTable areas. In SpreadsheetML, each PivotTable area maps to a collection of fields in the PivotTableDefinition that correspond to each area.
The following image shows the layout for the PivotTable areas.
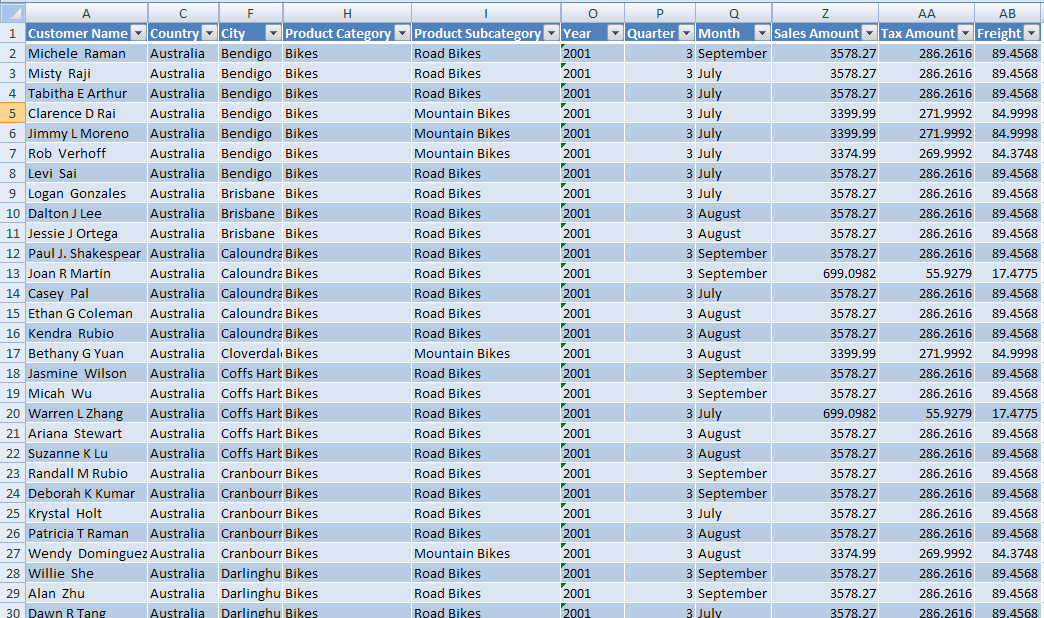
The following image shows a table of data in a worksheet.
The following image shows a PivotTable summary of the worksheet table data.
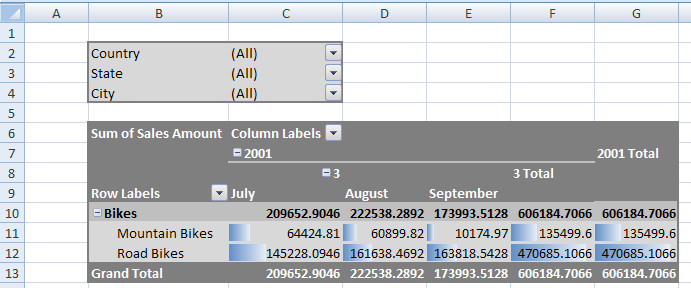
The filter area consists of the "Country", "State", and "City" fields. The row area consists of the "Product Category" and "Product Subcategory" fields. "Bikes" belongs to the "Product Category" field and both "Mountain Bikes" and "Road Bikes" belong to the "Product Subcategory" field. The column consists of the "Year" ("2001"), "Quarter" ("3"), and "Month" ("July", "August", and "September") fields.
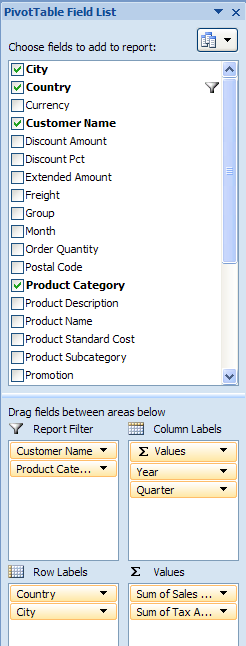
The following image shows the field list for the PivotTable in the previous image.
File Structure
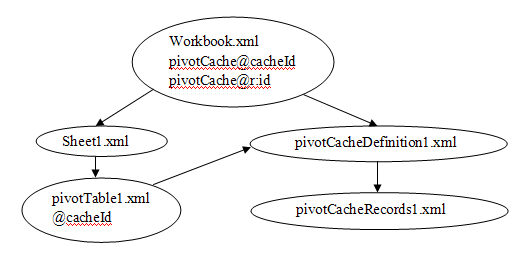
The workbook points to (and owns the longevity of) the pivotCacheDefinition part, which in turn points to and owns the pivotCacheRecords part. The workbook also points to and owns the sheet part, which in turn points to and owns a pivotTable part definition, when a PivotTable is on the sheet. There can be multiple PivotTables on a sheet. The pivotTable part points to the appropriate pivotCacheDefinition which it is using. Since multiple PivotTables can use the same cache, the pivotTable part does not own the longevity of the pivotCacheDefinition.
The pivotTable part describes the particulars of the layout of the PivotTable on the sheet. It indicates what fields are on the row axis, the column axis, report filter, and values areas of the PivotTable. It also indicates formatting information about the PivotTable. If conditional formatting has been applied to the PivotTable, that is also expressed in the pivotTable part.
Outline of XML for pivotTableDefinition
<pivotTableDefinition>
  <location/>
  <pivotFields/>
  <rowFields/>
  <rowItems/>
  <colFields/>
  <colItems/>
  <pageFields/>
  <dataFields/>
  <conditionalFormats/>
  <pivotTableStyleInfo/>
</pivotTableDefinition>
The pivotCacheRecords part contains the underlying data to be aggregated. It is a cache of the source data.
Outline of XML for pivotCacheRecords
<pivotCacheRecords/>
  <r/>
</pivotCacheRecords>
The pivotCacheDefinition part defines each field in the pivotCacheRecords part, including field name and information about the data contained in the field. The pivotCacheDefinition part also defines pivot items that are shared among the pivotTableDefinition and pivotCacheRecords parts.
Outline of XML for pivotCacheDefinition
<pivotCacheDefinition>
  <cacheSource/>
  <cacheFields>
    <cacheField>
      <sharedItems>
        <d/>
      </sharedItems>
      <fieldGroup/>
    </cacheField>
  </cacheFields>
</pivotCacheDefinition>