<ST_Style> (Style)
This simple type specifies that its contents will contain an integer between 1 and 48. The value determines the default formatting for all chart elements through the tables described below.
The default font is the minor font as defined by the document’s theme. The default font size for each element is the font size of the chart, except for the title which is always 120% the font size of the chart. If the chart does not have a font size set, then the default font size is 10. Axis titles and chart titles are bold by default, while all other chart elements are normal. The default font color is the same as the Axis & Major Gridlines Line Color.
The default line style, fill style, and effect style are determined by the tables below. Each of the default includes a themed line, fill, or effect (None, Subtle, Moderate, or Intense) and a color to be used when applying that line, fill, or effect. In some cases, both the themed formatting and the color vary per style, in other cases they do not. The default line width is determined by the theme, except for lines for data points it is multipled by the line width value given in the table.
Table 1: Chart element defaults
This table lists whether the default is constant or whether it depends on the ST_Style using one of the later tables.
Line |
Fill |
Effect |
||||
|---|---|---|---|---|---|---|
Chart Element |
Themed Line |
Color |
Themed Fill |
Color |
Themed Effect |
Color |
Axis |
Subtle |
Table 2 |
No Fill |
No Effect |
||
Axis Title |
No Line |
No Fill |
No Effect |
|||
Chart Area |
Table 2 |
Subtle |
Table 3 |
No Effect |
||
Chart Title |
No Line |
No Fill |
No Effect |
|||
Data Labels |
No Line |
No Fill |
No Effect |
|||
Data Table |
Subtle |
Table 2 |
No Fill |
No Effect |
||
Down Bars |
Table 4 |
Table 4 |
Table 4 |
dk1 |
||
Fills for Data Points (2-D) |
Subtle |
Table 5 |
Table 5 |
Table 5 |
dk1 |
|
Fills for Data Points (3-D) |
Subtle |
Table 5 |
Table 5 |
Table 5 |
dk1 |
|
Floor |
Table 2 |
Table 3 |
No Effect |
|||
Legend |
No Line |
No Fill |
No Effect |
|||
Lines for Data Points |
Subtle |
Table 5 |
N/A |
No Effect |
||
Major Gridlines |
Subtle |
Table 2 |
N/A |
No Effect |
||
Markers for Data Points |
Subtle |
Table 5 |
Table 5 |
Table 5 |
dk1 |
|
Minor Gridlines |
Subtle |
Table 2 |
N/A |
No Effect |
||
Other Lines |
Subtle |
Table 2 |
N/A |
No Effect |
||
Plot Area (2-D charts) |
No Line |
Subtle |
Table 3 |
No Effect |
||
Plot Area (3-D charts) |
No Line |
No Fill |
No Effect |
|||
Trendline Labels |
No Line |
No Fill |
No Effect |
|||
Up Bars |
Table 4 |
Table 4 |
Table 4 |
dk1 |
||
Walls |
No Line |
Table 3 |
No Effect |
|||
Other Lines includes Drop Lines, Error Bars, High Low Lines, Leader Lines, Series Lines, and Trendlines.
Fills for Data Points (2-D) includes 2-D bar, filled radar, stock, bubble, pie, doughnut and area charts.
Fills for Data Points (3-D) includes all 3-D charts.
Lines for Data Points includes lines on 2-D line, scatter, bubble, and radar charts.
Markers for Data Points includes markers on 2-D line, scatter, and radar charts.
Table 2: Default line formatting per chart style
This table lists line formatting for several chart elements by style.
Style |
Axis & Major Gridlines |
Minor Gridlines |
Chart Area, Data Table, & Floor |
Other Lines |
Floor & Chart Area |
|---|---|---|---|---|---|
Color |
Color |
Color |
Color |
Themed Line |
|
1-32 |
tx1 |
50% tint of tx1 |
75% tint of tx1 |
tx1 |
Subtle |
33-34 |
dk1 |
50% tint of tx1 |
75% tint of dk1 |
dk1 |
Subtle |
35-40 |
dk1 |
50% tint of tx1 |
75% tint of dk1 |
25% shade of dk1 |
Subtle |
41-48 |
dk1 |
90% tint of tx1 |
lt1 |
lt1 |
No Line |
Table 3: Default fill formatting per chart style
This table lists fill formatting for several chart elements by style.
Style |
Chart Area |
Floor, Walls & Plot Area (2-D) |
Floor & Walls |
|---|---|---|---|
Color |
Color |
Themed Fill |
|
1-32 |
bg1 |
bg1 |
No Fill |
33-34 |
lt1 |
20% tint of dk1 |
Subtle |
35-40 |
lt1 |
accent1-6 |
Subtle |
41-48 |
dk1 |
95% tint of dk1 |
Subtle |
Table 4: Up and down bars default formatting per chart style
This table lists line, fill, and effect formatting for up and down bars by style. The color listed as accent1-6 means that the first style uses accent1, the next uses accent2, up to the sixth uses accent6.
Up Bars |
Down Bars |
Up & Down Bars |
||||
|---|---|---|---|---|---|---|
Themed |
||||||
Style |
Fill Color |
Fill Color |
Fill |
Effect |
Line |
Line Color |
1 |
25% tint of dk1 |
85% tint of dk1 |
Subtle |
None |
Subtle |
tx1 |
2 |
5% tint of dk1 |
95% tint of dk1 |
Subtle |
None |
Subtle |
tx1 |
3-8 |
25% tint of accent1-6 |
25% shade of accent1-6 |
Subtle |
None |
Subtle |
tx1 |
9 |
25% tint of dk1 |
85% tint of dk1 |
Subtle |
Subtle |
Subtle |
tx1 |
10 |
5% tint of dk1 |
95% tint of dk1 |
Subtle |
Subtle |
Subtle |
tx1 |
11-16 |
25% tint of accent1-6 |
25% shade of accent1-6 |
Subtle |
Subtle |
Subtle |
tx1 |
17 |
25% tint of dk1 |
85% tint of dk1 |
Intense |
Moderate |
No ne |
None |
18 |
5% tint of dk1 |
95% tint of dk1 |
Intense |
Moderate |
None |
None |
19-24 |
25% tint of accent1-6 |
25% shade of accent1-6 |
Intense |
Moderate |
None |
None |
25 |
25% tint of dk1 |
85% tint of dk1 |
Intense |
Intense |
None |
None |
26 |
5% tint of dk1 |
95% tint of dk1 |
Intense |
Intense |
None |
None |
27-32 |
25% tint of accent1-6 |
25% shade of accent1-6 |
Intense |
Intense |
None |
None |
33 |
lt1 |
85% tint of dk1 |
Subtle |
None |
Subtle |
dk1 |
34 |
lt1 |
95% tint of dk1 |
Subtle |
None |
Subtle |
dk1 |
35-40 |
lt1 |
25% shade of accent1-6 |
Subtle |
None |
Subtle |
25% shade of accent1-6 |
41 |
25% tint of dk1 |
85% tint of dk1 |
Intense |
Intense |
None |
None |
42 |
lt1 |
dk1 |
Intense |
Intense |
None |
None |
43-48 |
25% tint of accent1-6 |
25% shade of accent1-6 |
Intense |
Intense |
None |
None |
Table 5: Default data point formatting per chart style
This table lists line, fill, and effect formatting for data points by style. Some of the formatting is a repeating pattern described in the next table (denoted by "Pattern"). Other use a fade pattern in which the first series is a certain% shade of the color listed and the last series is an certain% tint of the color listed. The intermediate colors are linearly interpolated by shade and tint to the listed color. The starting shade% and ending tint% are determined by the spreadsheet application, where shades are always darker than tints.
Note: A suggested way to implement this percentage is by using the formula: shade/tint percent = -70 + 140 * (SeriesFormattingIndex / (HighestFormattingIndexOfAllSeriesOnAllGraphs + 1)). In this case the series formatting index is the idx attribute value for the series. Negative outputs are shades, and positive outputs are tints.
Note: The arrows across the top of the table indicate which columns apply for that row: i.e., for Fills, Lines, or Markers. So, for example, only the last two columns for Lines for Data Points apply.
Fills for Data Points (2-D) |
↓ |
↓ |
↓ |
↓ |
||||
Fills for Data Points (3-D) |
↓ |
↓ |
↓ |
↓ |
||||
Lines for Data Points |
↓ |
↓ |
||||||
Markers for Data Points |
↓ |
↓ |
↓ |
|||||
Effect |
Fill |
Fill |
Fill |
Line |
Line |
Line |
Line |
|
Style |
Themed Effect |
Themed Fill |
Pattern |
Themed Fill |
Themed Line |
Color or Pattern |
Width |
Pattern |
1 |
No Effect |
Subtle |
1 |
Subtle |
No Line |
3 |
1 |
|
2 |
No Effect |
Subtle |
2 |
Subtle |
No Line |
3 |
2 |
|
3 |
No Effect |
Subtle |
accent1 fade |
Subtle |
No Line |
3 |
accent1 fade |
|
4 |
No Effect |
Subtle |
accent2 fade |
Subtle |
No Line |
3 |
accent2 fade |
|
5 |
No Effect |
Subtle |
accent3 fade |
Subtle |
No Line |
3 |
accent3 fade |
|
6 |
No Effect |
Subtle |
accent4 fade |
Subtle |
No Line |
3 |
accent4 fade |
|
7 |
No Effect |
Subtle |
accent5 fade |
Subtle |
No Line |
3 |
accent5 fade |
|
8 |
No Effect |
Subtle |
accent6 fade |
Subtle |
No Line |
3 |
accent6 fade |
|
9 |
Subtle |
Subtle |
1 |
Subtle |
Subtle |
lt1 |
5 |
1 |
10 |
Subtle |
Subtle |
2 |
Subtle |
Subtle |
lt1 |
5 |
2 |
11 |
Subtle |
Subtle |
accent1 fade |
Subtle |
Subtle |
lt1 |
5 |
accent1 fade |
12 |
Subtle |
Subtle |
accent2 fade |
Subtle |
Subtle |
lt1 |
5 |
accent2 fade |
13 |
Subtle |
Subtle |
accent3 fade |
Subtle |
Subtle |
lt1 |
5 |
accent3 fade |
14 |
Subtle |
Subtle |
accent4 fade |
Subtle |
Subtle |
lt1 |
5 |
accent4 fade |
15 |
Subtle |
Subtle |
accent5 fade |
Subtle |
Subtle |
lt1 |
5 |
accent5 fade |
16 |
Subtle |
Subtle |
accent6 fade |
Subtle |
Subtle |
lt1 |
5 |
accent6 fade |
17 |
Moderate |
Intense |
1 |
Subtle |
No Line |
5 |
1 |
|
18 |
Moderate |
Intense |
2 |
Intense |
No Line |
5 |
2 |
|
19 |
Moderate |
Intense |
accent1 fade |
Subtle |
No Line |
5 |
accent1 fade |
|
20 |
Moderate |
Intense |
accent2 fade |
Subtle |
No Line |
5 |
accent2 fade |
|
21 |
Moderate |
Intense |
accent3 fade |
Subtle |
No Line |
5 |
accent3 fade |
|
22 |
Moderate |
Intense |
accent4 fade |
Subtle |
No Line |
5 |
accent4 fade |
|
23 |
Moderate |
Intense |
accent5 fade |
Subtle |
No Line |
5 |
accent5 fade |
|
24 |
Moderate |
Intense |
accent6 fade |
Subtle |
No Line |
5 |
accent6 fade |
|
25 |
Intense |
Intense |
1 |
Subtle |
No Line |
7 |
1 |
|
26 |
Intense |
Intense |
2 |
Intense |
No Line |
7 |
2 |
|
27 |
Intense |
Intense |
accent1 fade |
Subtle |
No Line |
7 |
accent1 fade |
|
28 |
Intense |
Intense |
accent2 fade |
Subtle |
No Line |
7 |
accent2 fade |
|
29 |
Intense |
Intense |
accent3 fade |
Subtle |
No Line |
7 |
accent3 fade |
|
30 |
Intense |
Intense |
accent4 fade |
Subtle |
No Line |
7 |
accent4 fade |
|
31 |
Intense |
Intense |
accent5 fade |
Subtle |
No Line |
7 |
accent5 fade |
|
32 |
Intense |
Intense |
accent6 fade |
Subtle |
No Line |
7 |
accent6 fade |
|
33 |
No Effect |
Subtle |
1 |
Subtle |
Subtle |
50% shade of dk1 |
5 |
1 |
34 |
No Effect |
Subtle |
2 |
Subtle |
Subtle |
Pattern 3 |
5 |
2 |
35 |
No Effect |
Subtle |
accent1 fade |
Subtle |
Subtle |
50% shade of accent1 |
5 |
accent1 fade |
36 |
No Effect |
Subtle |
accent2 fade |
Subtle |
Subtle |
50% shade of accent2 |
5 |
accent2 fade |
37 |
No Effect |
Subtle |
accent3 fade |
Subtle |
Subtle |
50% shade of accent3 |
5 |
accent3 fade |
38 |
No Effect |
Subtle |
accent4 fade |
Subtle |
Subtle |
50% shade of accent4 |
5 |
accent4 fade |
39 |
No Effect |
Subtle |
accent5 fade |
Subtle |
Subtle |
50% shade of accent5 |
5 |
accent5 fade |
40 |
No Effect |
Subtle |
accent6 fade |
Subtle |
Subtle |
50% shade of accent6 |
5 |
accent6 fade |
41 |
Intense |
Intense |
4 |
Subtle |
No Line |
5 |
4 |
|
42 |
Intense |
Intense |
2 |
Intense |
No Line |
5 |
2 |
|
43 |
Intense |
Intense |
accent1 fade |
Subtle |
No Line |
5 |
accent1 fade |
|
44 |
Intense |
Intense |
accent2 fade |
Subtle |
No Line |
5 |
accent2 fade |
|
45 |
Intense |
Intense |
accent3 fade |
Subtle |
No Line |
5 |
accent3 fade |
|
46 |
Intense |
Intense |
accent4 fade |
Subtle |
No Line |
5 |
accent4 fade |
|
47 |
Intense |
Intense |
accent5 fade |
Subtle |
No Line |
5 |
accent5 fade |
|
48 |
Intense |
Intense |
accent6 fade |
Subtle |
No Line |
5 |
accent6 fade |
|
Table 6: Default data point formatting per data point
This table contains the formatting patterns used for each data point when there are is one series, or each series when there is just one series. The patterns in this table can repeat, see the pictures below the table for an illustration.
Pattern |
Data Point 1 |
Data Point 2 |
Data Point 3 |
Data Point 4 |
Data Point 5 |
Data Point 6 |
|---|---|---|---|---|---|---|
1 |
88.5% tint of dk1 |
55% tint of dk1 |
78% tint of dk1 |
92.5% tint of dk1 |
70% tint of dk1 |
30% tint of dk1 |
2 |
accent1 |
accent2 |
accent3 |
accent4 |
Accent5 |
accent6 |
3 |
50% shade of accent1 |
50% shade of accent2 |
50% shade of accent3 |
50% shade of accent4 |
50% shade of accent5 |
50% shade of accent6 |
4 |
5% tint of dk1 |
55% tint of dk1 |
78% tint of dk1 |
15% tint of dk1 |
70% tint of dk1 |
30% tint of dk1 |
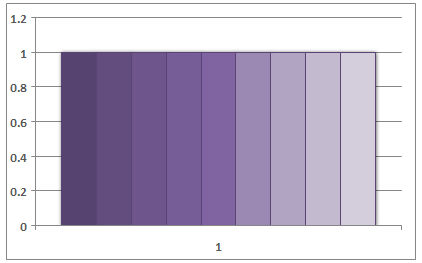
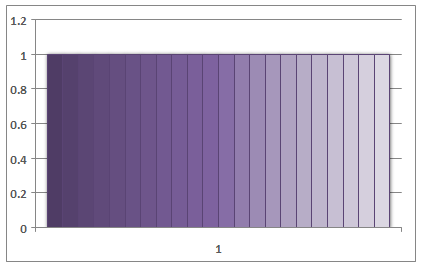
Above are two charts showing the same monochromatic pattern, just with a different number of series. Note that these charts just have tint and shade adjusted for each series beginning and ending at the same values.
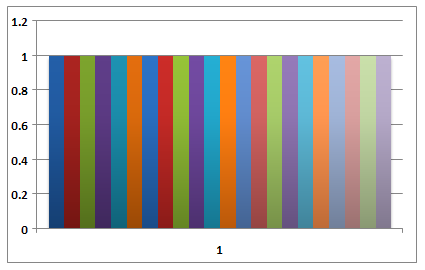
Above is a pattern that has 6 distinct accent colors. The colors repeat every 6 data points, but the tint/shade is changed for each set.
This simple type's contents are a restriction of the XML Schema unsignedByte datatype.
This simple type also specifies the following restrictions:
This simple type has a minimum value of greater than or equal to 1.
This simple type has a maximum value of less than or equal to 48.
Referenced By |
|---|
|
The following XML Schema fragment defines the contents of this simple type:
<simpleType name="ST_Style">
	<restriction base="xsd:unsignedByte">
	<minInclusive value="1"/>
	<maxInclusive value="48"/>
	</restriction>
</simpleType>