Feature Overview
PivotTables display aggregated views of data easily and in an understandable layout. Hundreds or thousands of pieces of underlying information can be aggregated on row & column axes, revealing the meanings behind the data. PivotTable reports are used to organize and summarize your data in different ways. Creating a PivotTable report is about moving pieces of information around to see how they fit together. In a few gestures the pivot rows and columns can be moved into different arrangements and layouts.
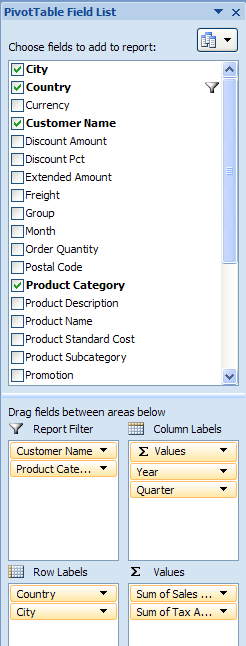
A PivotTable object has a row axis area, a column axis area, a values area, and a report filter area. Additionally, PivotTables have a corresponding field list pane displaying all the fields of data which can be placed on one of the PivotTable areas.
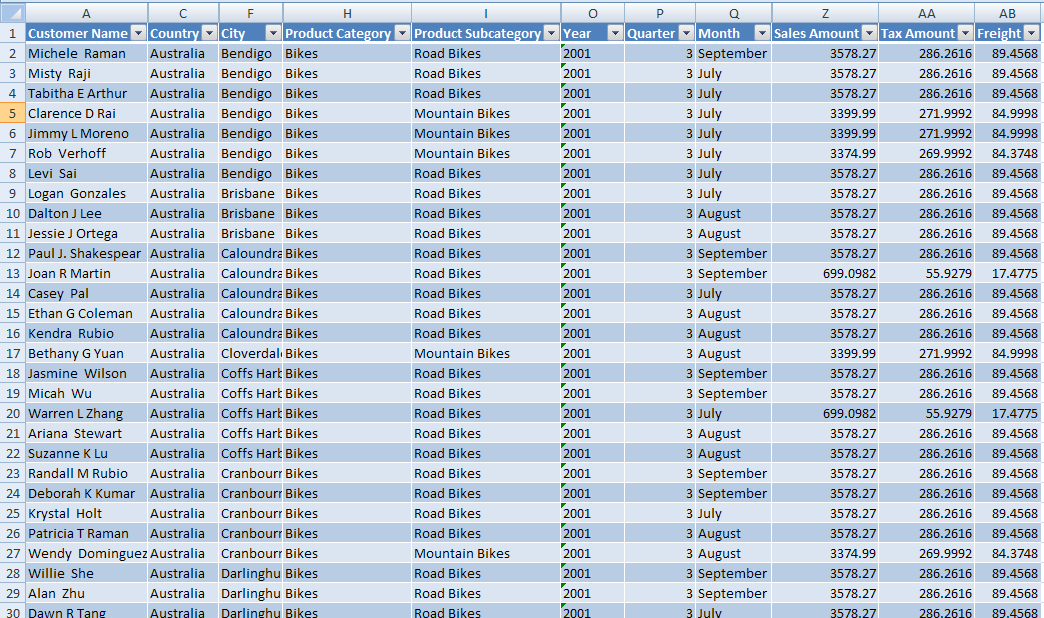
Consider this source data:
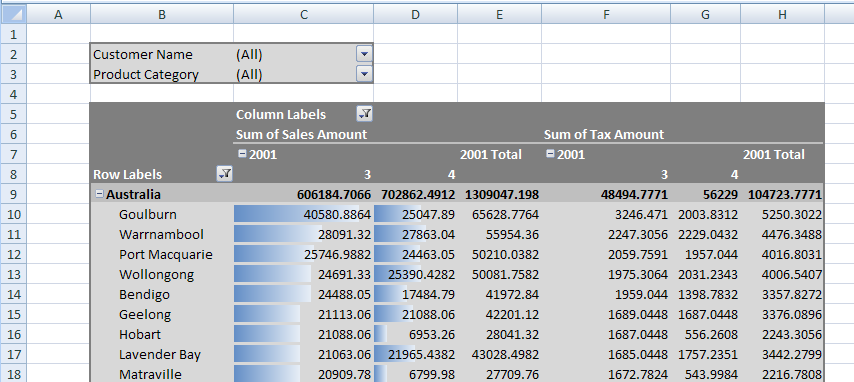
This data can be consolidated and summarized in a PivotTable. One way to organize the information would look like this:
Here is the corresponding PivotTable field list: