Illustration
Consider the source data pictured in the overview section. There are 28 fields of data in total (some aren't shown). A corresponding PivotTable summary of the data can look like this:
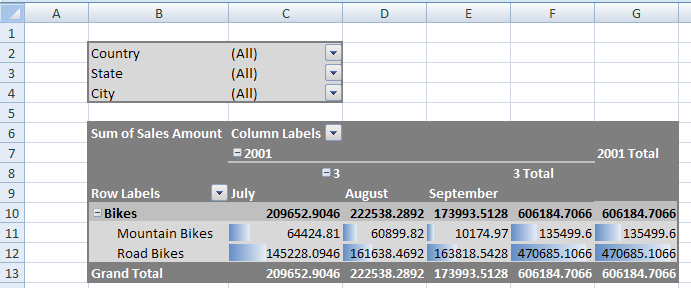
Regarding the layout of the PivotTable, notice that "Country", "State", and "City" are in the report filter area of the PivotTable. "Product Category" and "Product Subcategory" are on the row axis ("Bikes" belongs to the "Product Category" field and both "Mountain Bikes" and "Road Bikes" belong to the "Product Subcategory" field). On the column axis are "Year" ("2001"), "Quarter" ("3"), and "Month" ("July", "August", and "September") fields.
Row Grand Totals are turned on, and column Subtotals are turned on for Quarter and Year (if there was more than 1 quarter in the source data the Year Subtotal would be more interesting).